Reinventing FusionCharts’ product strategy
Background
FusionCharts is one of the top JavaScript charting libraries worldwide. It enables developers to create stunning data visualizations on their applications and websites.
As Head of Products, this was my second major initiative after fixing the release cadence across the organization. In a shrinking market, we had to reinvent ourselves to grow again. I worked with the leadership to redefine FusionCharts into a Business Intelligence product from the JavaScript charting library.
Problem definition
Growing FusionCharts once again: In the late 2000s, FusionCharts was one of the fastest-growing technology companies in India. Everyone from Whitehouse to Apple, Salesforce to Atlassian used FusionCharts for data visualization. However, with the rise of open-source software, the data visualization market began to shrink rapidly by the late 2010s. As a result, FusionCharts' growth declined rapidly. As a company, it was time to reinvent ourselves and grow again.
Discovery
Market research
- Market research is essential for starting any good venture. As a company, we had expertise in Developer Ecosystems and Data Visualization. Therefore, we decided to study both markets.
- When FusionCharts was founded, the data visualization industry was relatively new. Today, two decades later, it has transformed into a billion-dollar industry known as Business Intelligence (BI), dominated by PowerBI (Microsoft), Tableau (Salesforce), and Qlik, among others.
- Similarly, we have been building products for developers. As a result, the developer ecosystem has also grown into multiple billion-dollar industries, such as Application Development Lifecycle and API Platforms. Like BI, this industry is also dominated by major players such as Microsoft, Atlassian, Amazon, and Google.
- FusionCharts was constantly battling against open source; hence, moving into the developer ecosystem was not a scalable idea except, if you get into infrastructure and DevOps like Amazon Web Services, Microsoft Azure, Google Compute Cloud, Atlassian, etc.
- We always excelled in data visualization; hence, we decided to move forward with the Business Intelligence (BI) industry.
The BI Opportunity
- The Business Intelligence (BI) industry is worth over $20 billion, and is primarily divided into two parts:
- Self-service analytics: Enables CIOs and their teams to make sense of data easily. Most products, such as PowerBI, Tableau, and Domo, cater to this audience.
- Embedded analytics: Allows software products to embed a reporting layer in their applications. Out of the $20 billion, around $5 billion belongs to Embedded Analytics, where no clear leader exists.
- With our expertise in developer ecosystems and data visualization, Embedded Analytics was the best industry to focus on.
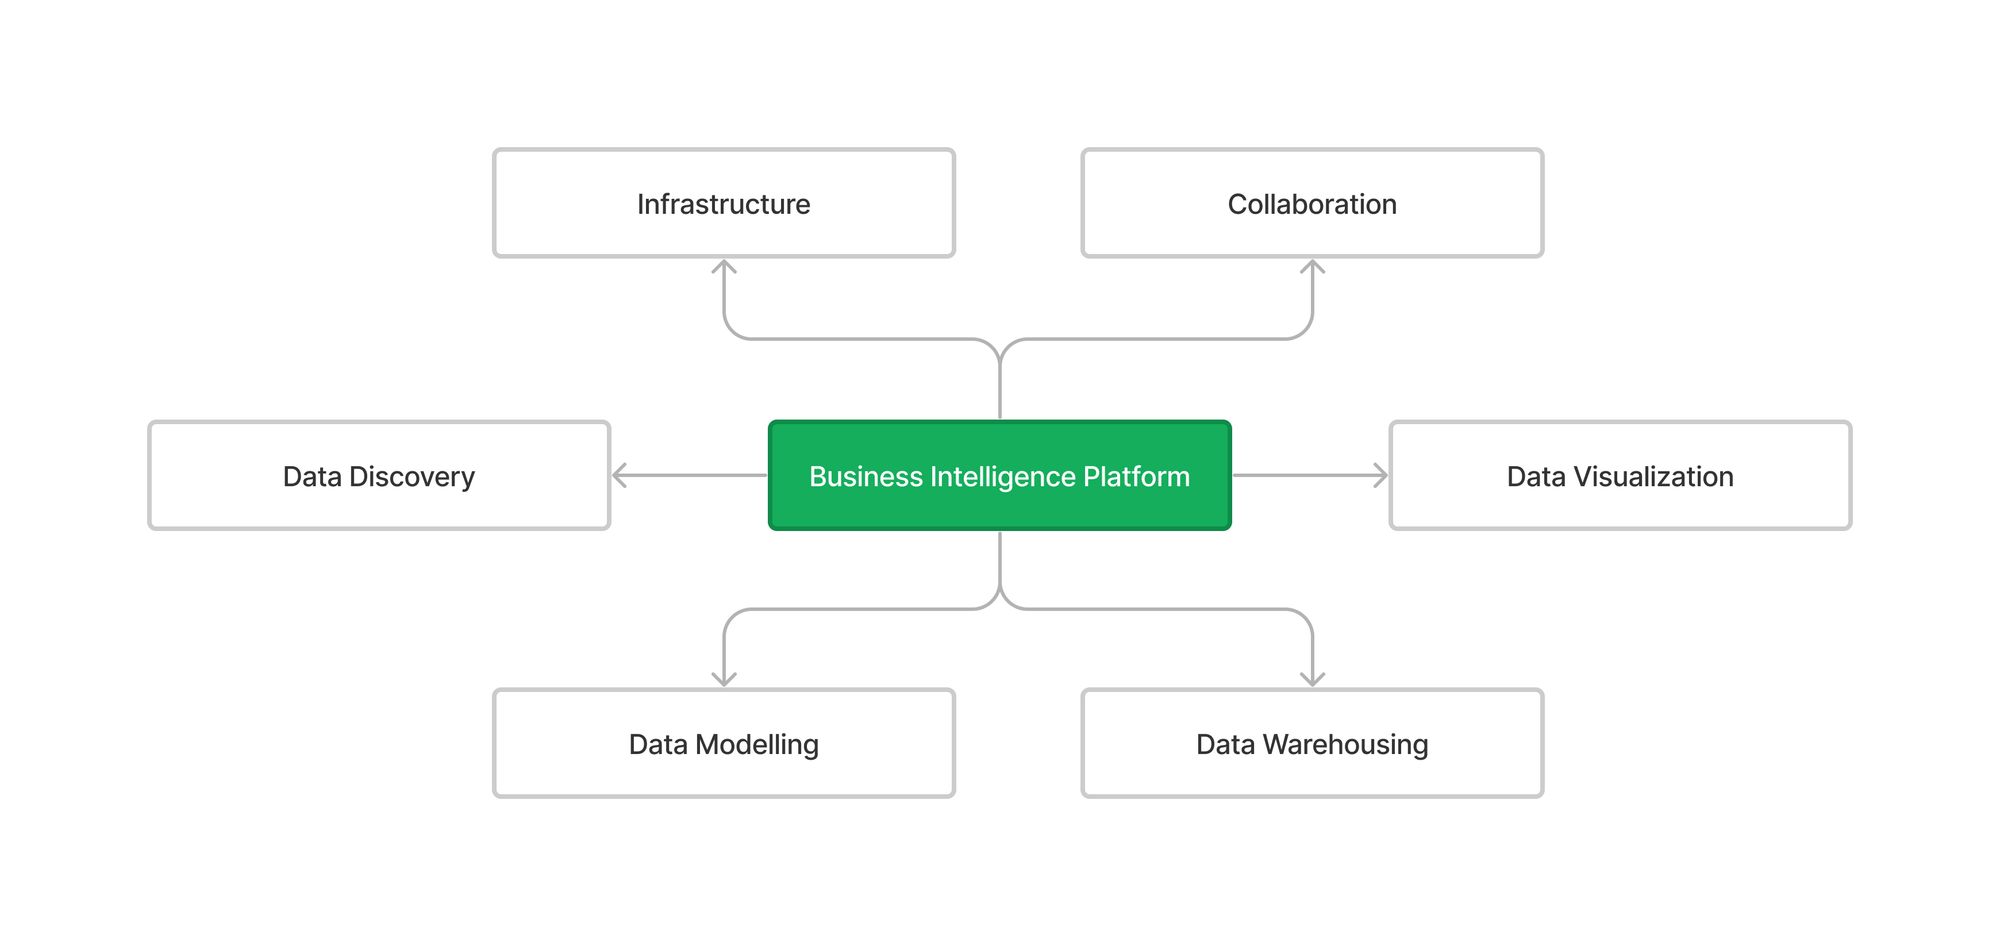
- Any BI product is divided into the following components:
- Infrastructure: How the whole BI application is hosted and will be scaled.
- Data Warehousing: How the data is stored. It could come from various sources like Google BigQuery, MongoDB, SQL Servers, or third-party apps like Salesforce, HubSpot, etc.
- Data Modelling: Ability to structure the data, especially when the data is coming from various sources.
- Data Discovery and Analysis: Analyse the data, and find trends (probably using NLP and ML).
- Data Visualization: Visualize this data so consumers can get data-driven insights and make decisions.
- Collaboration: Share this data and insights with others and collaborate.
- If we had to move into BI, we had to build solutions for all the components. Since our expertise was primarily in the front end, we came up with potential products that could help us build solutions for these components in the near future.
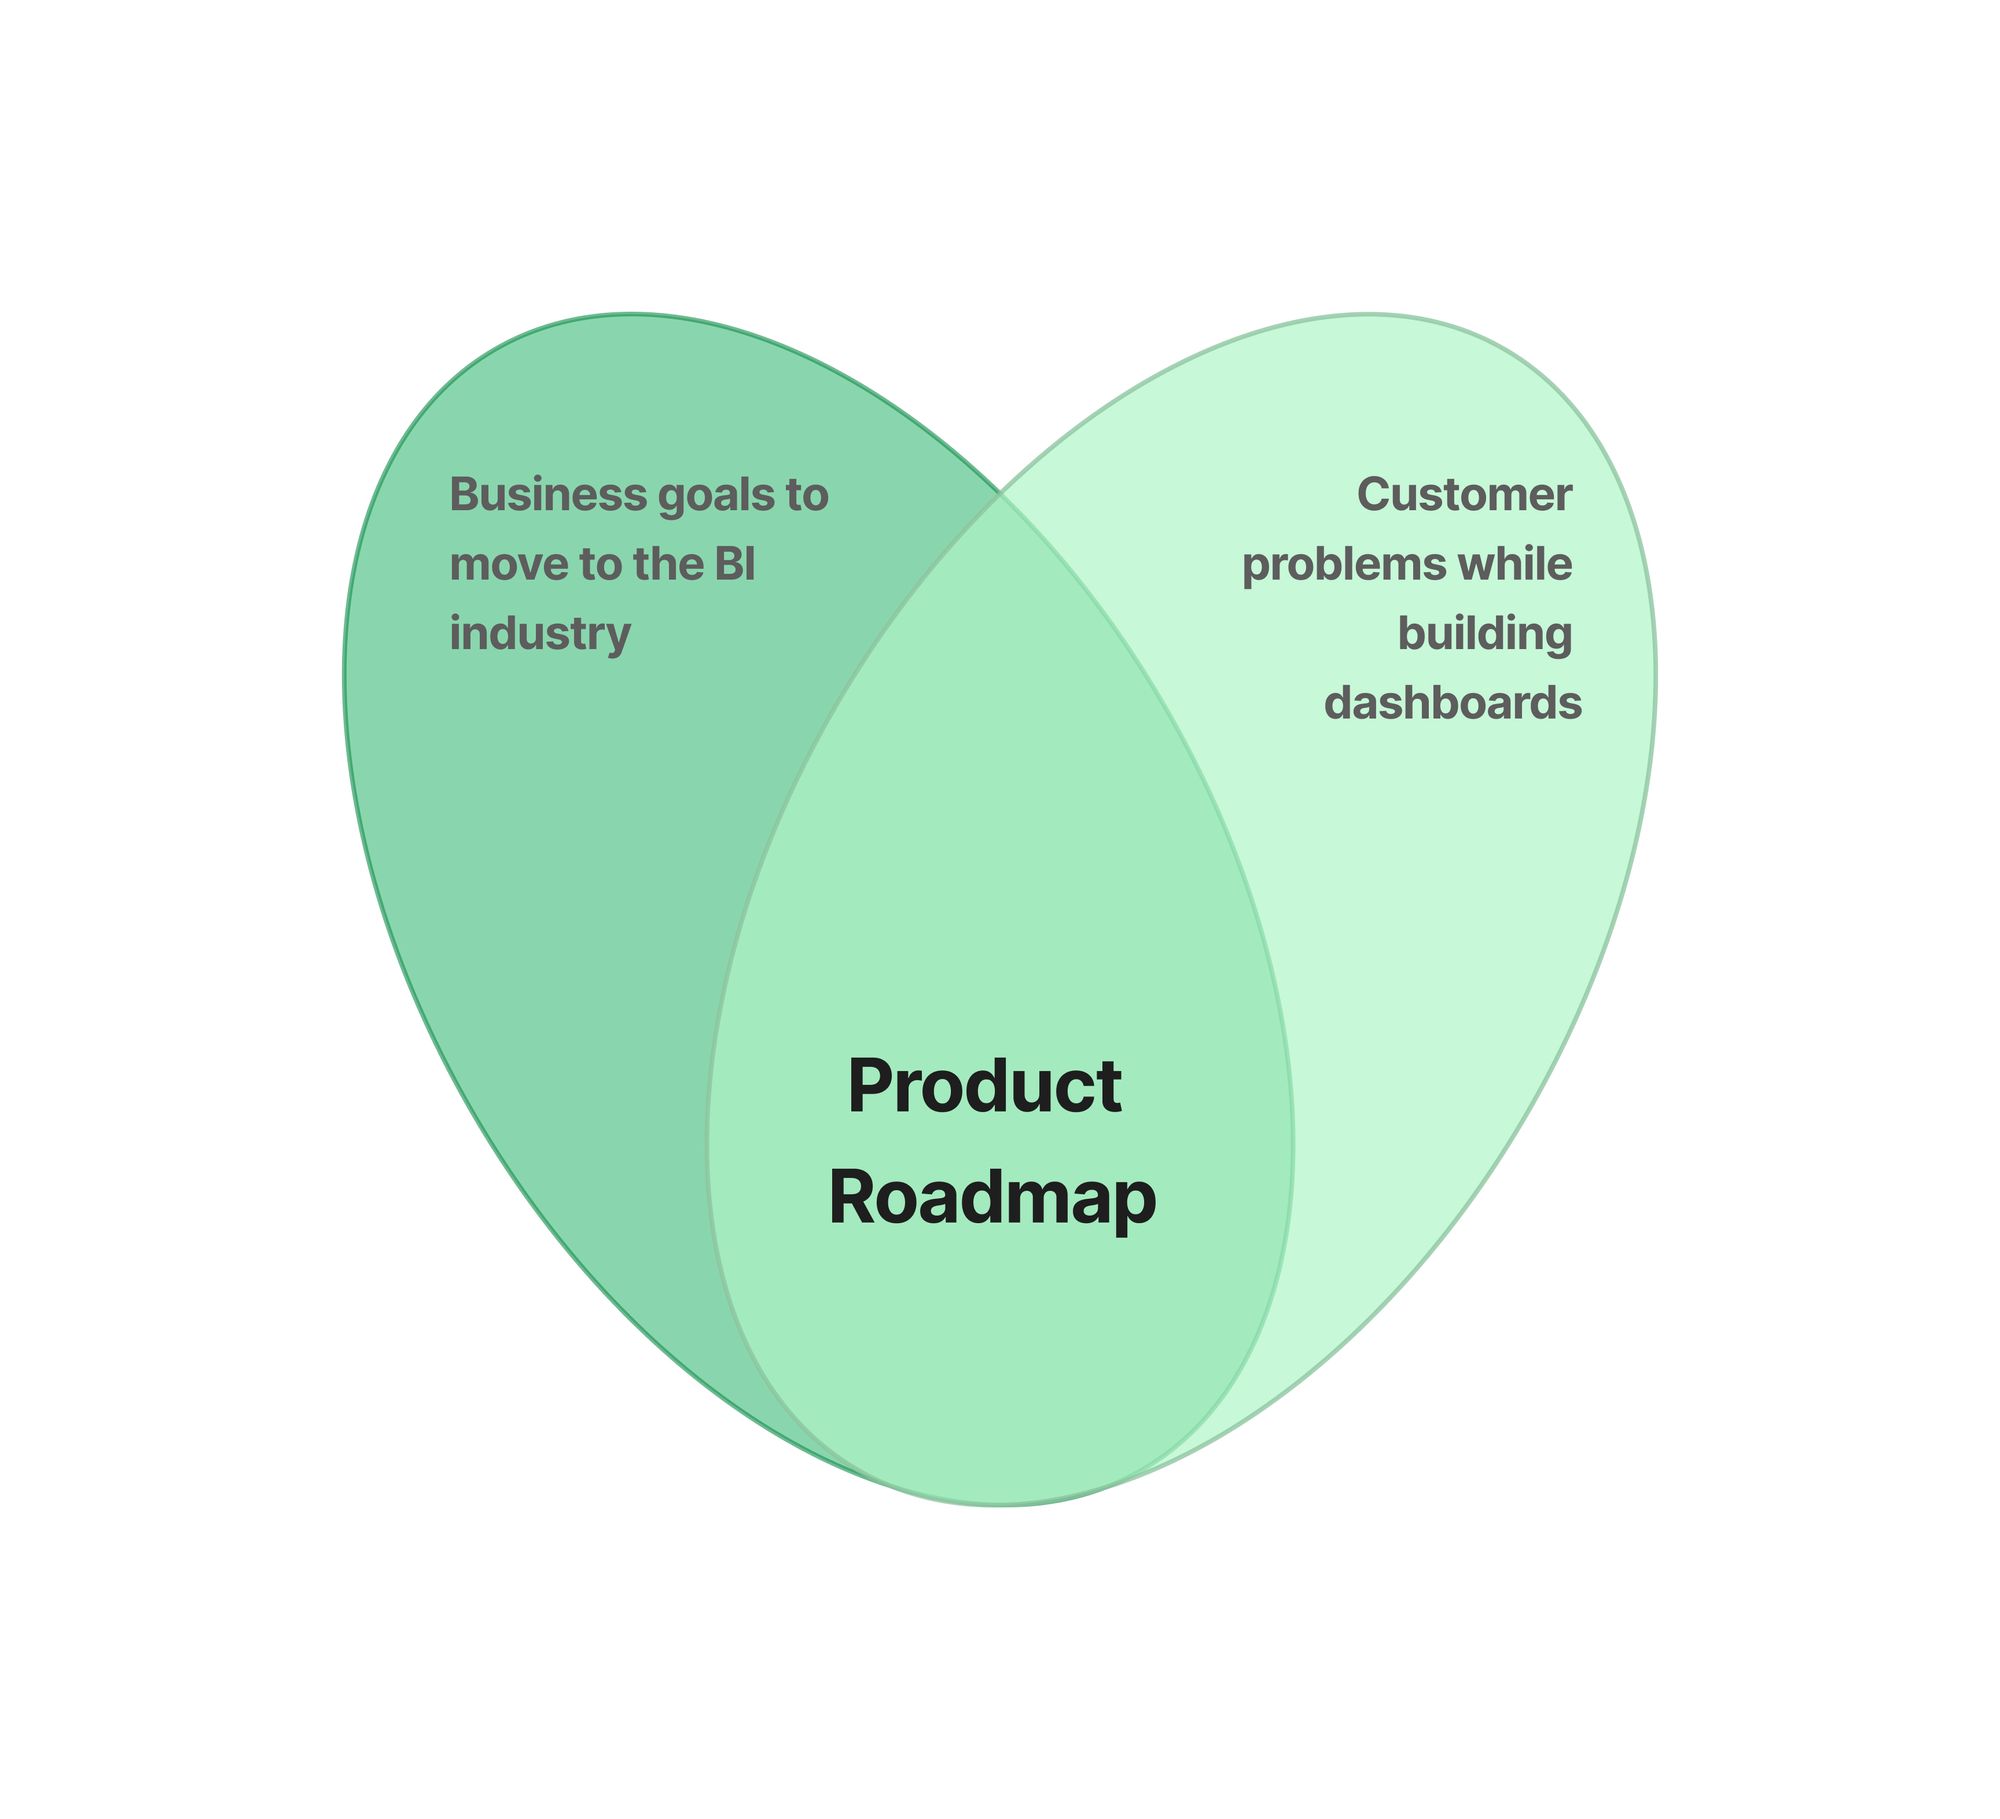
- Furthermore, we also spoke with some of the customers who build SaaS dashboards and BI products and came up with a roadmap of new products that could help us move in this direction.
Execution
Mission statement
- Our idea was to slowly move in the BI paradigm by building products that users will pay for (and use regularly). We deliberately decided against building a full-fledged Embedded BI product because that would have taken at least 3-4 years. Being a bootstrapped company, we were not open to exploring where we could have burned millions of dollars without earning anything in return.
- Once it was clear that we were moving into the BI industry, we needed to develop a mission statement that was easy to communicate and rally the entire organization behind it.
- We called it “Charts to Dashboard Journey.” Although as simple as it sounds, it was incredibly effective. When planning one of the sprints, a Junior Developer criticized our decision by asking, “How does this initiative fit ‘charts to dashboard journey’?”. It was one of the proudest moments for me because I had never met this person; All I had done was, present the 2-3 years roadmap to the engineering and product teams. And yet he was rallying behind the common goal. It proved the importance of a mission statement and how effective was the current statement.
- After determining the business goals, and customer requirements, we developed a few products that could help us move in that direction in the next 12-18 months.
- FusionExport: Ability to run a server that could export any dashboard to PDF, PNG, JPEG, or even run cron jobs to send alerts.
- FusionGrid: Grid visualization product that complemented the charting product.
- FusionDataStore: Cross-platform client-side data management library that could manage millions of data and run CRUD (Create, Read, Update, Delete) operations along with aggregation at an incredibly fast speed. We eventually filed a patent for this (which is still pending).
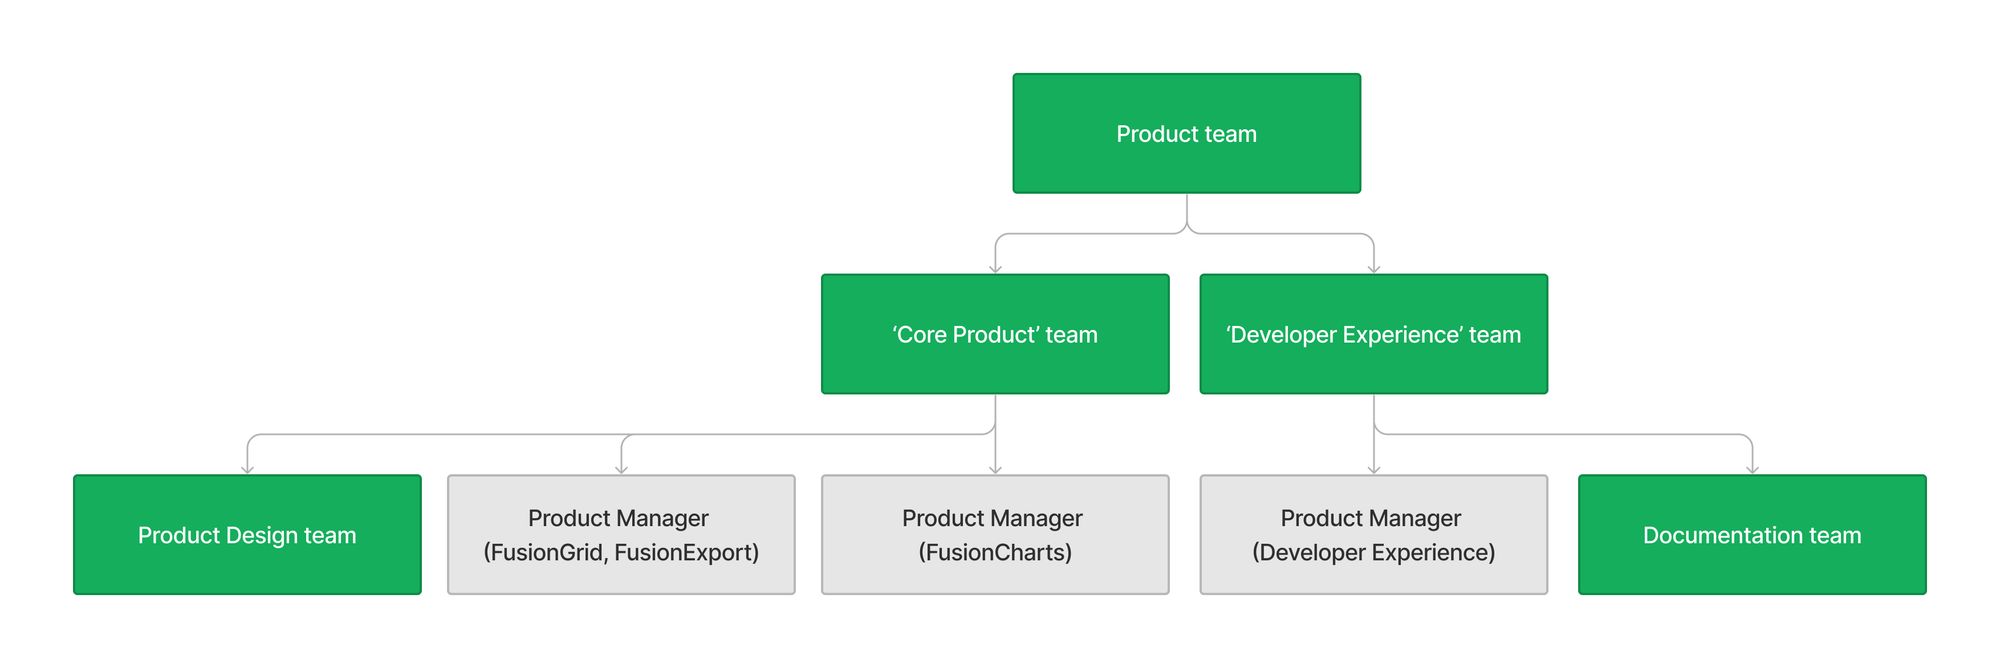
- To build these products, I was tasked with building a solid product team which I managed to set up in a few months. The team was intact till FusionCharts was acquired.
Results
- We started growing again for the first time in almost 3-4 years. However, the major credit belongs to the sales team. Without the product team’s initiatives and swifter release cadence, it wouldn't have been possible.
- We released two new paid products and took them to product-market fit, which helped us slowly diversify the revenue.
- We filed three patents, out of which one of the patents has been approved while others are still pending. It improved our intangible assets. But most important, it was a testimony to our constant endeavor to innovate.
- After the acquisition, the new parent company acquired one of the Embedded Analytics companies within two years: Yellowfin. This was also a testament to our vision.
You might also like
Get the latest posts delivered right to your inbox.
Prefer RSS? Use this URL in your favorite RSS reader: https://nihar.sawant.me/rss