Economics of Software (Part 3): When to invest in infrastructure?
Learn the importance of the cost curve and how to plot them. Furthermore, learn to make crucial decisions like when to invest in infrastructure.

It is the third part of the series on Economics of Software. You can find the entire series below:
- Part 1: Why traditional economics concepts do not apply to software?
- Part 2: Elasticity of demand explained for software products
- Part 3: When to invest in the infrastructure?
- Part 4: Measuring the efficiency of product teams using the output curve
In the earlier essays, we learned about the supply and demand of software. How traditional concepts may not be directly relevant to the software industry. Furthermore, we explored what elastic and inelastic products are; why building inelastic product is essential. In this essay, we will learn how to measure efficiency and determine when to invest in infrastructure.
What is a cost curve?
A cost curve determines the operational efficiency of a business. In economics, a cost curve allows you to establish a relationship between the production and quantity of goods. Let’s take an example of a traditional industry like the manufacturing of mobile phones.
| Number of Employees | 1 | 2 | 3 | 4 | 5 |
| Quantity Produced | 500 | 2000 | 3300 | 3800 | 4000 |
| Variable Cost | $100 | $200 | $300 | $400 | $500 |
| Fixed Cost | $100 | $100 | $100 | $100 | $100 |
| Total Cost | $200 | $300 | $400 | $500 | $600 |
The cost of an employee is $100/month; as you keep adding employees, the cost will increase, and so will the number of mobiles manufactured. The fixed cost (in this case, it could be rent) is $100/mo. So regardless of the increase in the employees, the fixed cost remains the same. Now let’s plot the total cost:
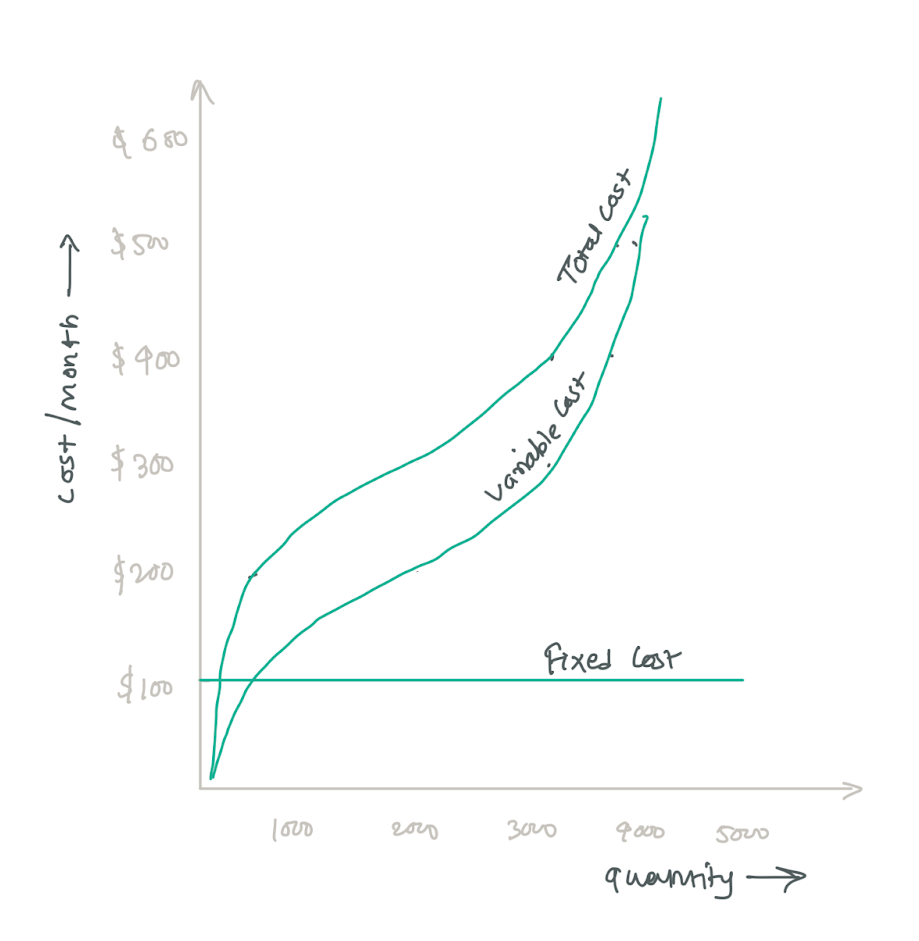
As we keep adding more employees, the curve gets steeper. It indicates that employees are becoming more and more unproductive. Similarly, let’s calculate and plot the average cost; it will help us understand the efficiency better.
| Number of Employees | 1 | 2 | 3 | 4 | 5 |
| Quantity Produced | 500 | 2000 | 3300 | 3800 | 4000 |
| Average Cost / Mobile | $0.4 | $0.15 | $0.12 | $0.13 | $0.15 |
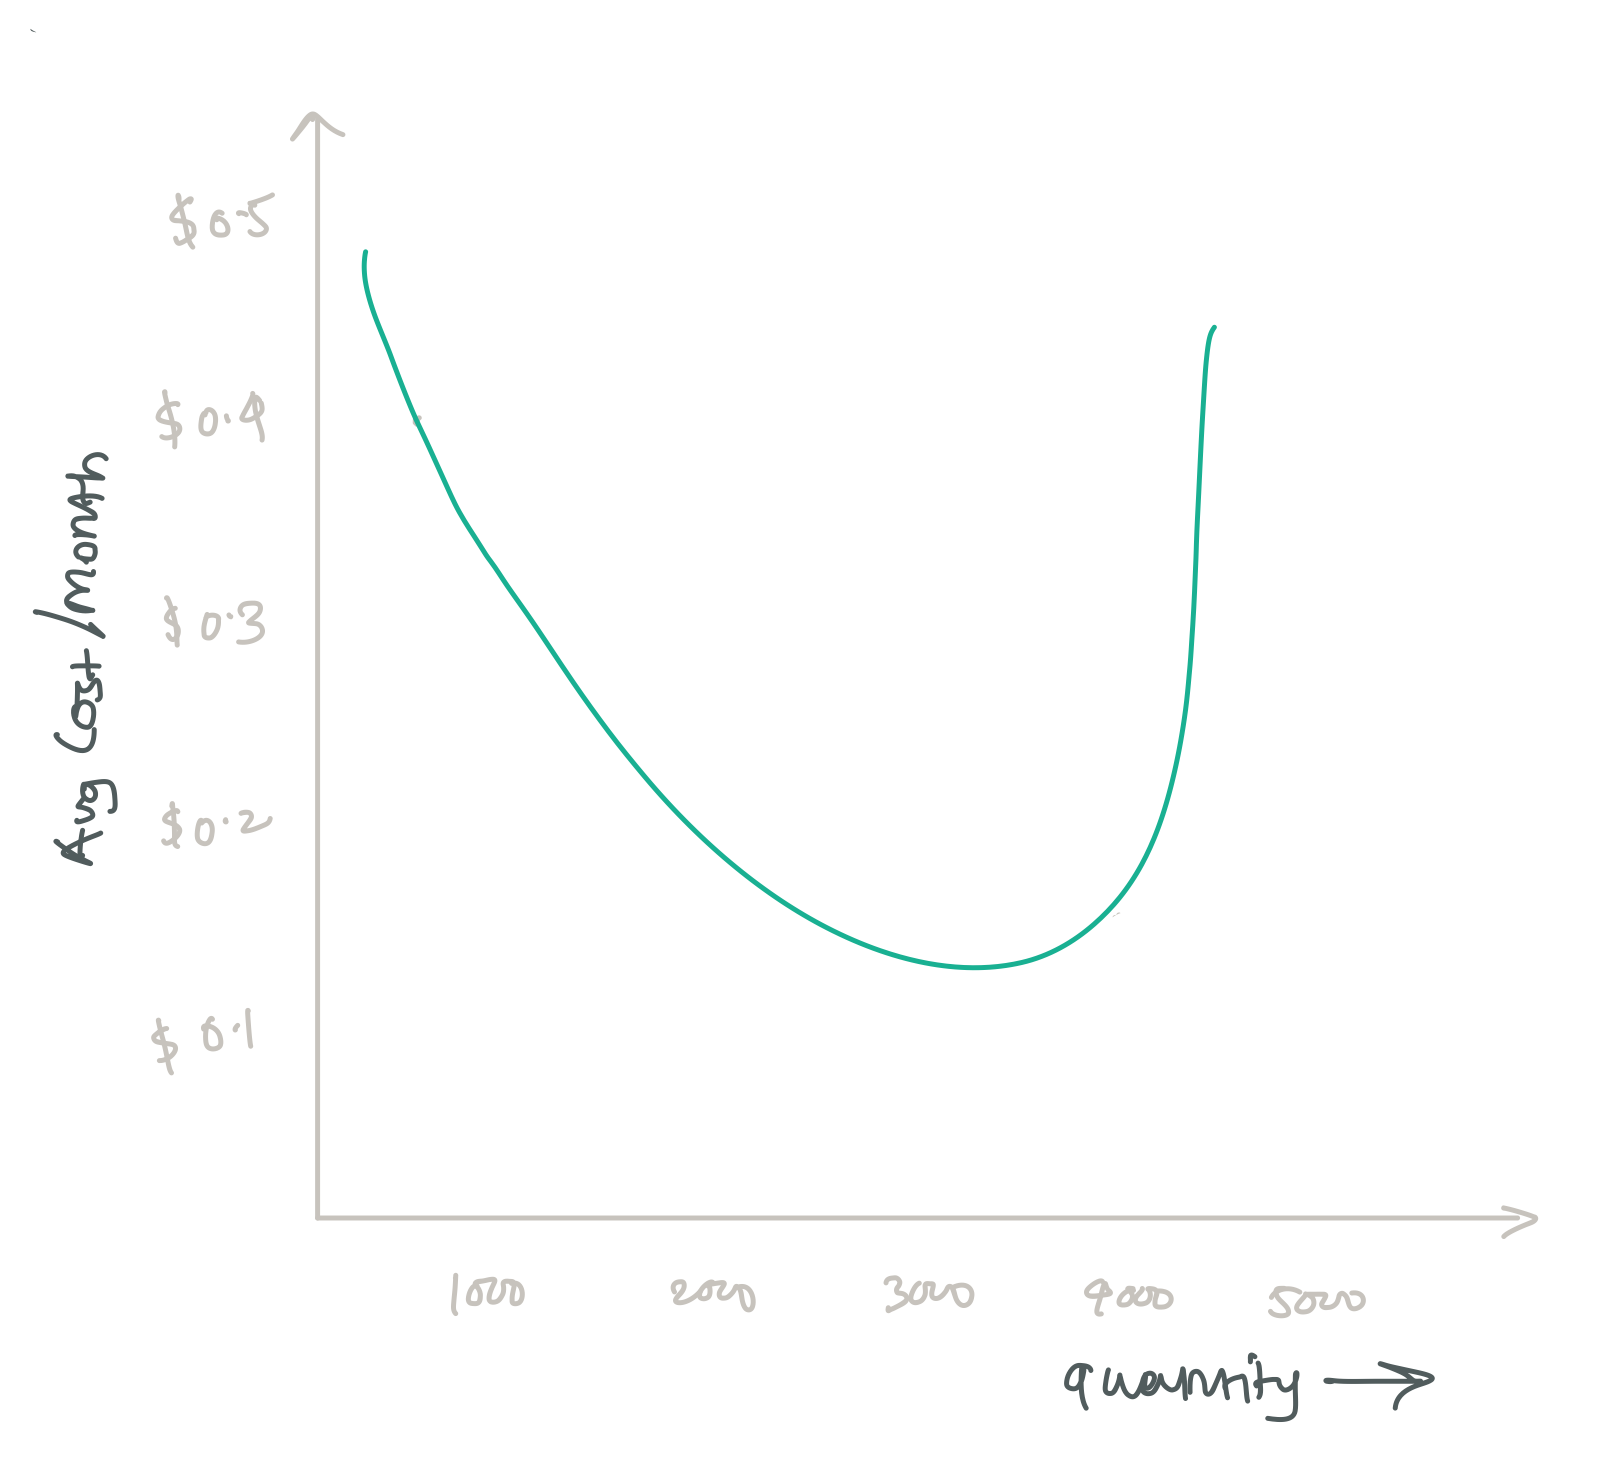
As you can see in the chart, the average cost starts dramatically increasing after we have more than three employees. So this could be the time when we need to invest in the infrastructure. For example, having one manufacturing line with more than three employees is not productive, so it is better to invest in another manufacturing line and employ other people.
Let’s plot the cost curve for a server
Let’s take a hypothetical example of server costs and active users. As we discussed earlier, the software industry does not follow the traditional supply and demand model, where an increase in supply increases the quantity produced. Once you have software available, you can make infinite copies. In this case, we will plot against the ‘active users’ of the software:
| Active Users | 25 | 50 | 75 | 100 | 125 | 150 |
| Average Server Cost | $5,000 | $7,500 | $9,000 | $14,000 | $20,000 | $26,000 |
| Average Cost / User | $200 | $150 | $120 | $140 | $160 | $173.33 |
As you noticed above, after 75 active users, the cost started to increase drastically. This is the place where we need to start investing in infrastructure optimization. You must be wondering what infrastructure optimization is. There are different ways:
- Caching: When you have just released a product or a feature, you will likely not invest in caching. Instead, you would simply fetch the data from the database as it is. In the beginning, it won’t cost you much, but as the number of active users increases, you will start bleeding money because querying a database is expensive. This is the time when you could invest in caching libraries like Redis or Memcache. These services act as an intermediary between a database and a client. Most common queries are served by these services, helping you reduce cost.
- Indexing: If you use SQL as a database, querying them could take time as the active users increase. Simple practices like indexing could save bandwidth.
- Technical Debts: Technical debts occur when engineers sacrifice quality over speed of execution. Ideally, they should be addressed regularly. Otherwise, it is good to invest some time to deal with them.
- Performance Optimizations: Optimizing the source code too early is called Pre-mature Optimizations, but as mentioned earlier, once you understand the right time, it is worth spending time on it. It could involve refactoring the code, implementing a few techniques (similar to caching), etc.
- Cleanups: You have no idea the amount of space storage, backups, unused staging servers could occupy especially, when you are building the product for a few years—simple audit to save a lot of costs.
- Platform rewrite: Rewriting the entire infrastructure could vary from multiple quarters to years. Back 2010s, Twitter’s failwhale had become a meme. They rewrote their whole platform for a couple of years to deal with this problem. While rewriting, you need to be sure about the opportunity cost. In the case of Twitter, it was already hampering their growth, costing them millions of dollars.
How you could plot a cost curve of your product
Plotting a cost curve for your product requires two things: active users and billing data. I will not define active users, but please keep in mind that it is not the same as user signups. You could signup millions of users with, but hardly 10 of them will use the platform. Now coming back to the billing, very likely you must be using AWS, Google Compute, Digital Ocean as your infrastructure. All these platforms provide a detailed statement of the services every month. You can use these numbers to determine the cost. If you have multiple products hosted on the same database, you need to comb through the details to decide which services belong to your product. Eventually, you could use the aggregated cost as a server cost. Since billing information is fetched every month, it is best to have Monthly Active Users data ready.
Once you have MAU and billing data ready, you can plot the cost curve.
How does this help me as a Product Manager?
Learn to say ‘no’
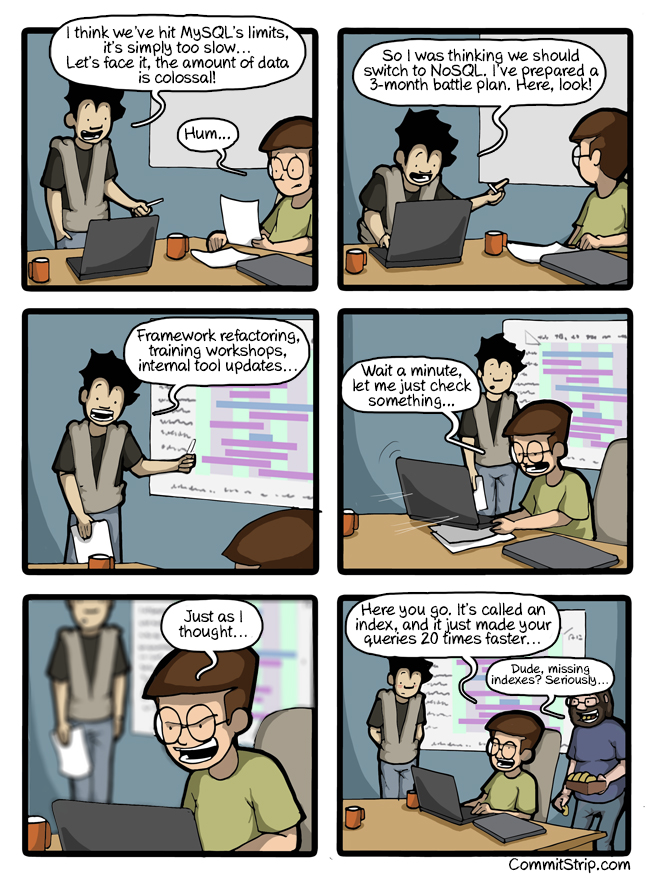
There is a new framework and library released every other month, and it is pretty tempting for engineers to jump out of the ship by initializing mega rewrites! Even the finest architects could fall for this trap. In his famous essay, Joel Spolsky advised, “You don’t have to rewrite the whole thing. When optimizing for speed, 1% of the work gets you 99% of the bang!” But as a PM, you should understand the opportunity cost. In the above example, if an engineer would have told you to rewrite the infrastructure when there are hardly 50 active users, you should say no. Because it is not worth it. The cost starts increasing when there are more than 100 users. Here is a comic that sums it up neatly:
Rationalization of engineering decisions
It is always difficult to justify decisions like technical debts, architecture rewrites, optimizations, etc. You can’t quantify these decisions even though these are beneficial to the engineering teams in the longer run. Martin Fowler wrote a wonderful essay on the importance of technical debts, but he agrees that it is difficult to measure. Understanding the cost curve could help you visualize when there is a need for improvement and take decisions accordingly.
Plotting a cost curve requires you to understand two essential data points, Active Users and Operational Costs. If you have a subscription model, you can calculate the revenue using active users as well i.e., Gross Revenue. All these data points are sufficient for you to determine the gross margin of the product. Although the gross margin is a topic for another day, a good software product generally has a gross margin of 70%.
I hope understanding the cost curve was helpful to you. Feel free to share your feedback at nihar@sawant.me. I am more than happy to hear your thoughts.
You might also like
Get the latest posts delivered right to your inbox.
Prefer RSS? Use this URL in your favorite RSS reader: https://nihar.sawant.me/rss