Economics of Software (Part 4): Measuring the efficiency of product teams using the output curve
Do you face conundrums while determining when and whom to hire? Learn how to measure efficiency using output curves, determine the right time to expand your team.

It is the fourth part of the series on Economics of Software. You can find the entire series below:
- Part 1: Why traditional economics concepts do not apply to software?
- Part 2: Elasticity of demand explained for software products
- Part 3: When to invest in the infrastructure using the cost curve?
- Part 4: Measuring the efficiency of product teams using the output curve
So far, we have covered many concepts like supply and demand, the elasticity of products, cost curves to determine operational efficiency. This essay will explore the output curve to assess efficiency. Furthermore, when and whom to hire.
What is an output curve?
An output curve is a relationship between the number of employees and their output. It helps us determine the efficiency of the employees. The output curve for traditional industries like manufacturing consists of the number of goods manufactured by the employees. Let’s take the example of mobile phone manufacturing from the earlier essay.
| Number of Employees | 1 | 2 | 3 | 4 | 5 |
| Quantity Produced | 500 | 2000 | 3300 | 3800 | 4000 |
| Average Quantity Produced | 500 | 1000 | 1100 | 950 | 800 |
As we keep adding employees, the amount of the goods produced also increase. But it does not tell us anything about the efficiency. So let’s take the average of the number of goods produced per employee and plot a graph:
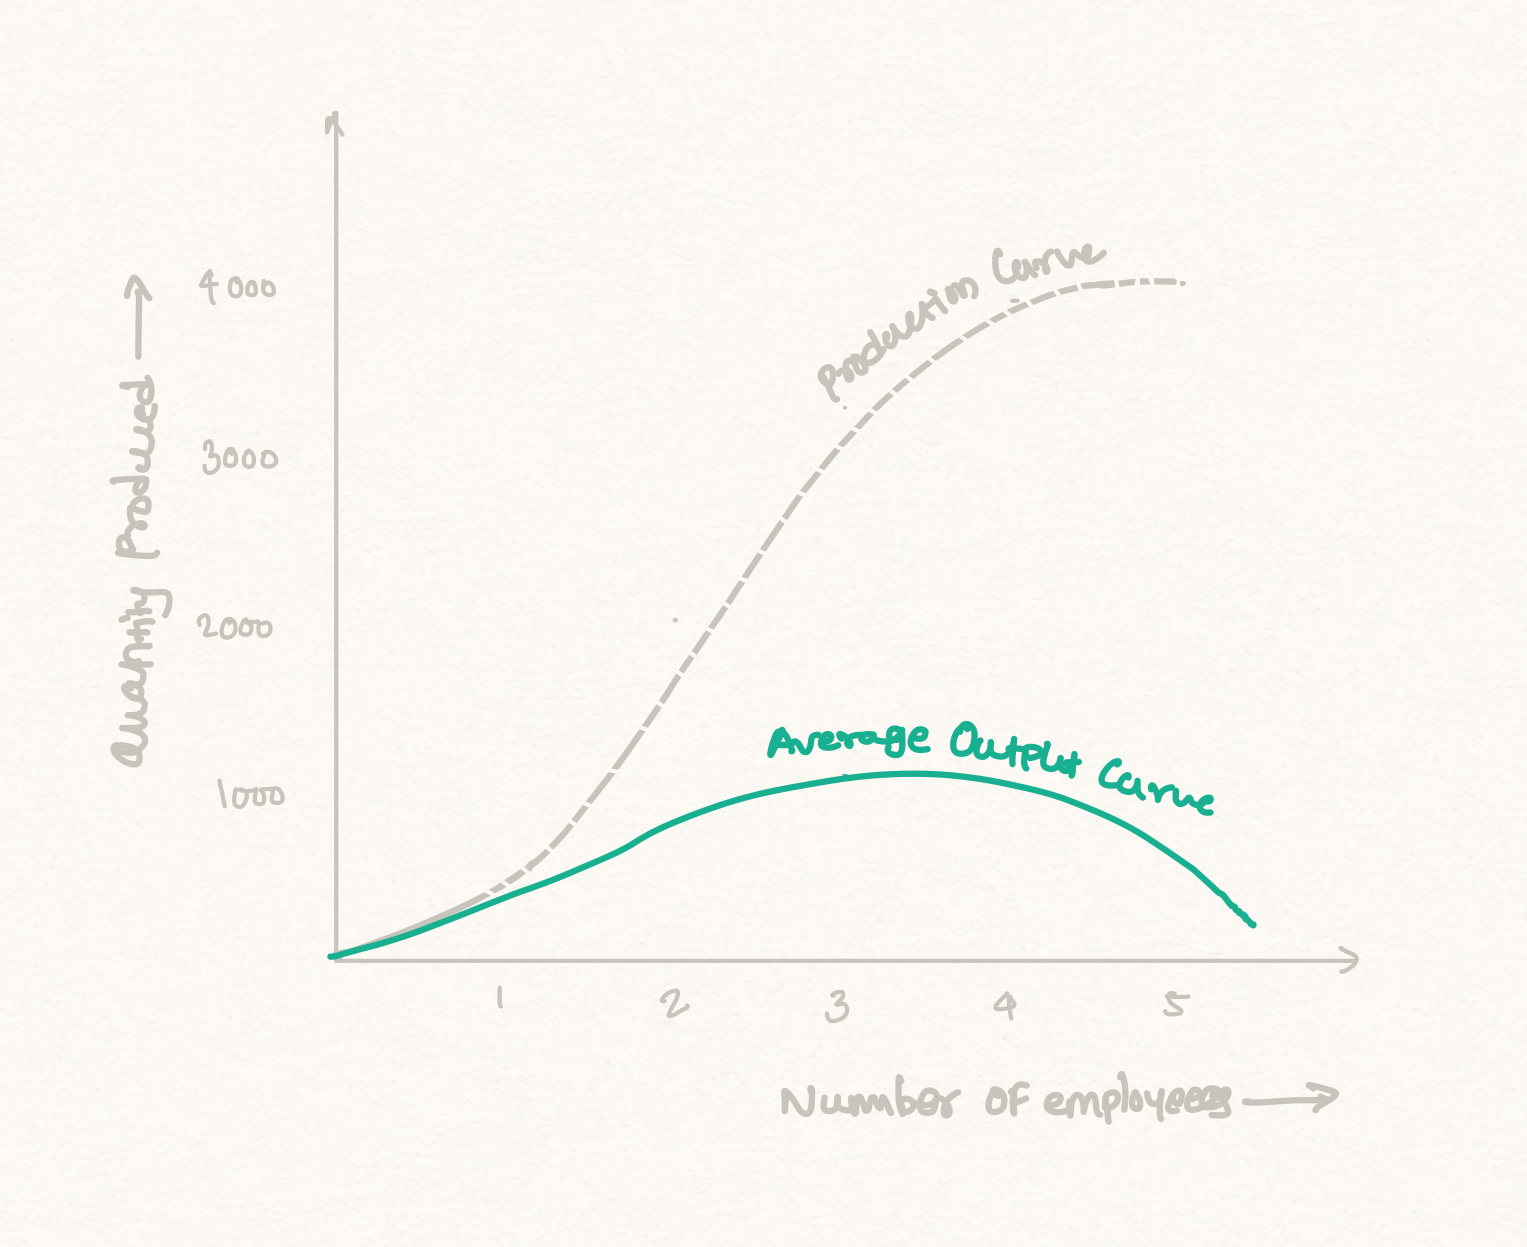
After we add the 4th employee, productivity decreases. If we plot the same curve with the cost curve learned earlier, we will get a complete picture of the operational efficiency. It provides us with helpful information about how to grow. For example, in this case, every manufacturing unit should not have more than three employees. Let’s try to understand something similar for software teams.
Plotting output curve for Scrum teams
As I mentioned a few times before, the marginal cost for software is almost zero. Once you have the product ready, you can produce infinite copies. This makes it difficult to plot an output curve. However, we could achieve this if you have a Scrum team. Scrum is an agile project management technique focused on increasing efficiency and reducing wastage. It has a concept of story points and velocity that could be useful here. I won’t go deep into the explanation of Scrum because that’s a topic for another day, but let me provide you an overview:
- Scrum consists of breaking down the project into smaller chunks called sprints. The duration of these sprints could be two weeks (or more, but it should be constant)
- Every feature you will cover in the sprint has a weightage called story points.
- These story points differ from feature to feature. For example, if a feature is complex, it will have higher story points and vice versa.
Now, let’s take a hypothetical example and plot an output curve:
| Number of Employees | 1 | 2 | 3 | 4 | 5 |
| Total Story Points per Sprint | 11 | 24 | 39 | 44 | 50 |
| Average Story Points (Velocity) | 11 | 12 | 13 | 11 | 10 |
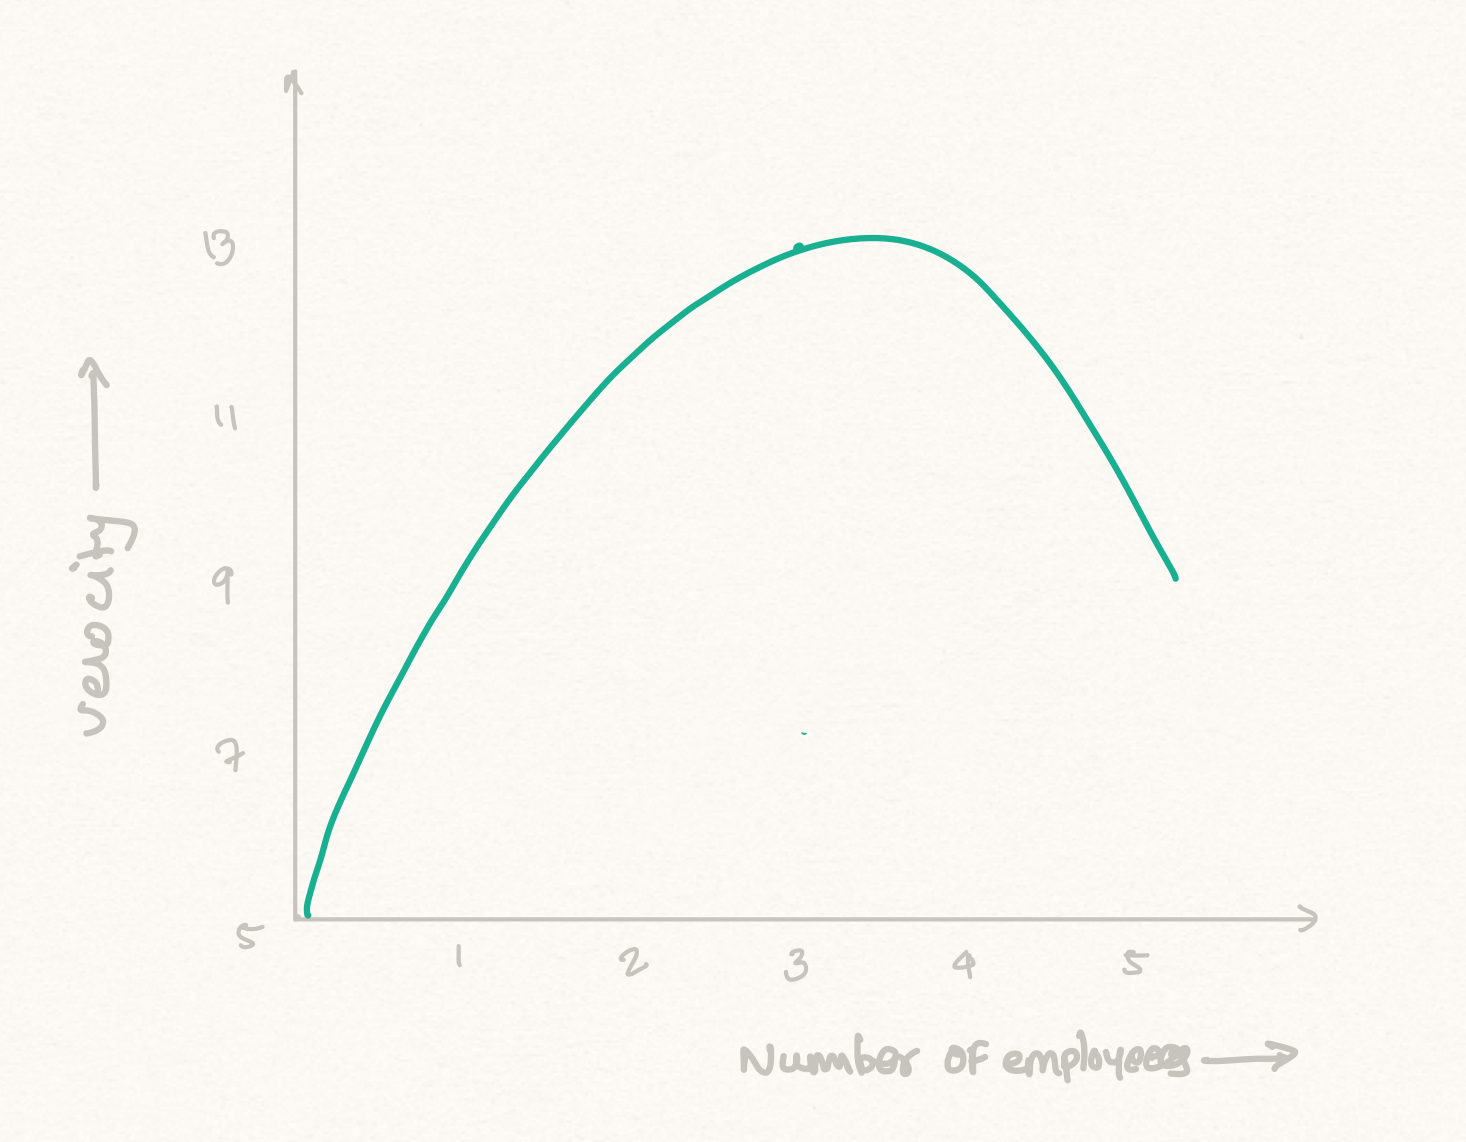
As per the graph above, having more than three engineers per team would reduce productivity. So it is best not to have more than three engineers per project.
However, there are a few flaws with Scrum. First, the story points are subjective to every team. So if you have a huge engineering team, the story points will vary from team to team. So this method becomes unreliable. Hence, we need to determine a different way for an efficient hiring process.
Hiring matrix for product organizations
We have established that measuring productivity could be difficult for software companies. Unless we get clarity about productivity, it is difficult to understand when to hire. But as a product organization, we should not employ recklessly. Although there are metrics like revenue per employee, it comes into the picture after hiring. So let’s try to take a jab at it.
There are two segments in a product organization:
- Supply team: Consists of engineers, QA, designers, product managers who drive the supply side of the software
- Demand team: Consists of sales and marketing folks who drive the demand side of the software.
Unlike other industries, KPIs for both supply and demand defer because of the zero marginal cost of the software. The demand side has clear KPIs like increasing sales or customer acquisition. And the supply side, well, there isn’t one that could directly relate to the business. You have performance and release frequency, but it is not directly related to the supply side metrics. To understand the hiring strategy for the product team, we need both supply and demand to have the same metrics. So how could we do that? Adoption and Acquisition.
- Adoption: As the name suggests, deals with the supply side.
- Acquisition: As we already established, it deals with the demand side.
Have a look at the diagram below:
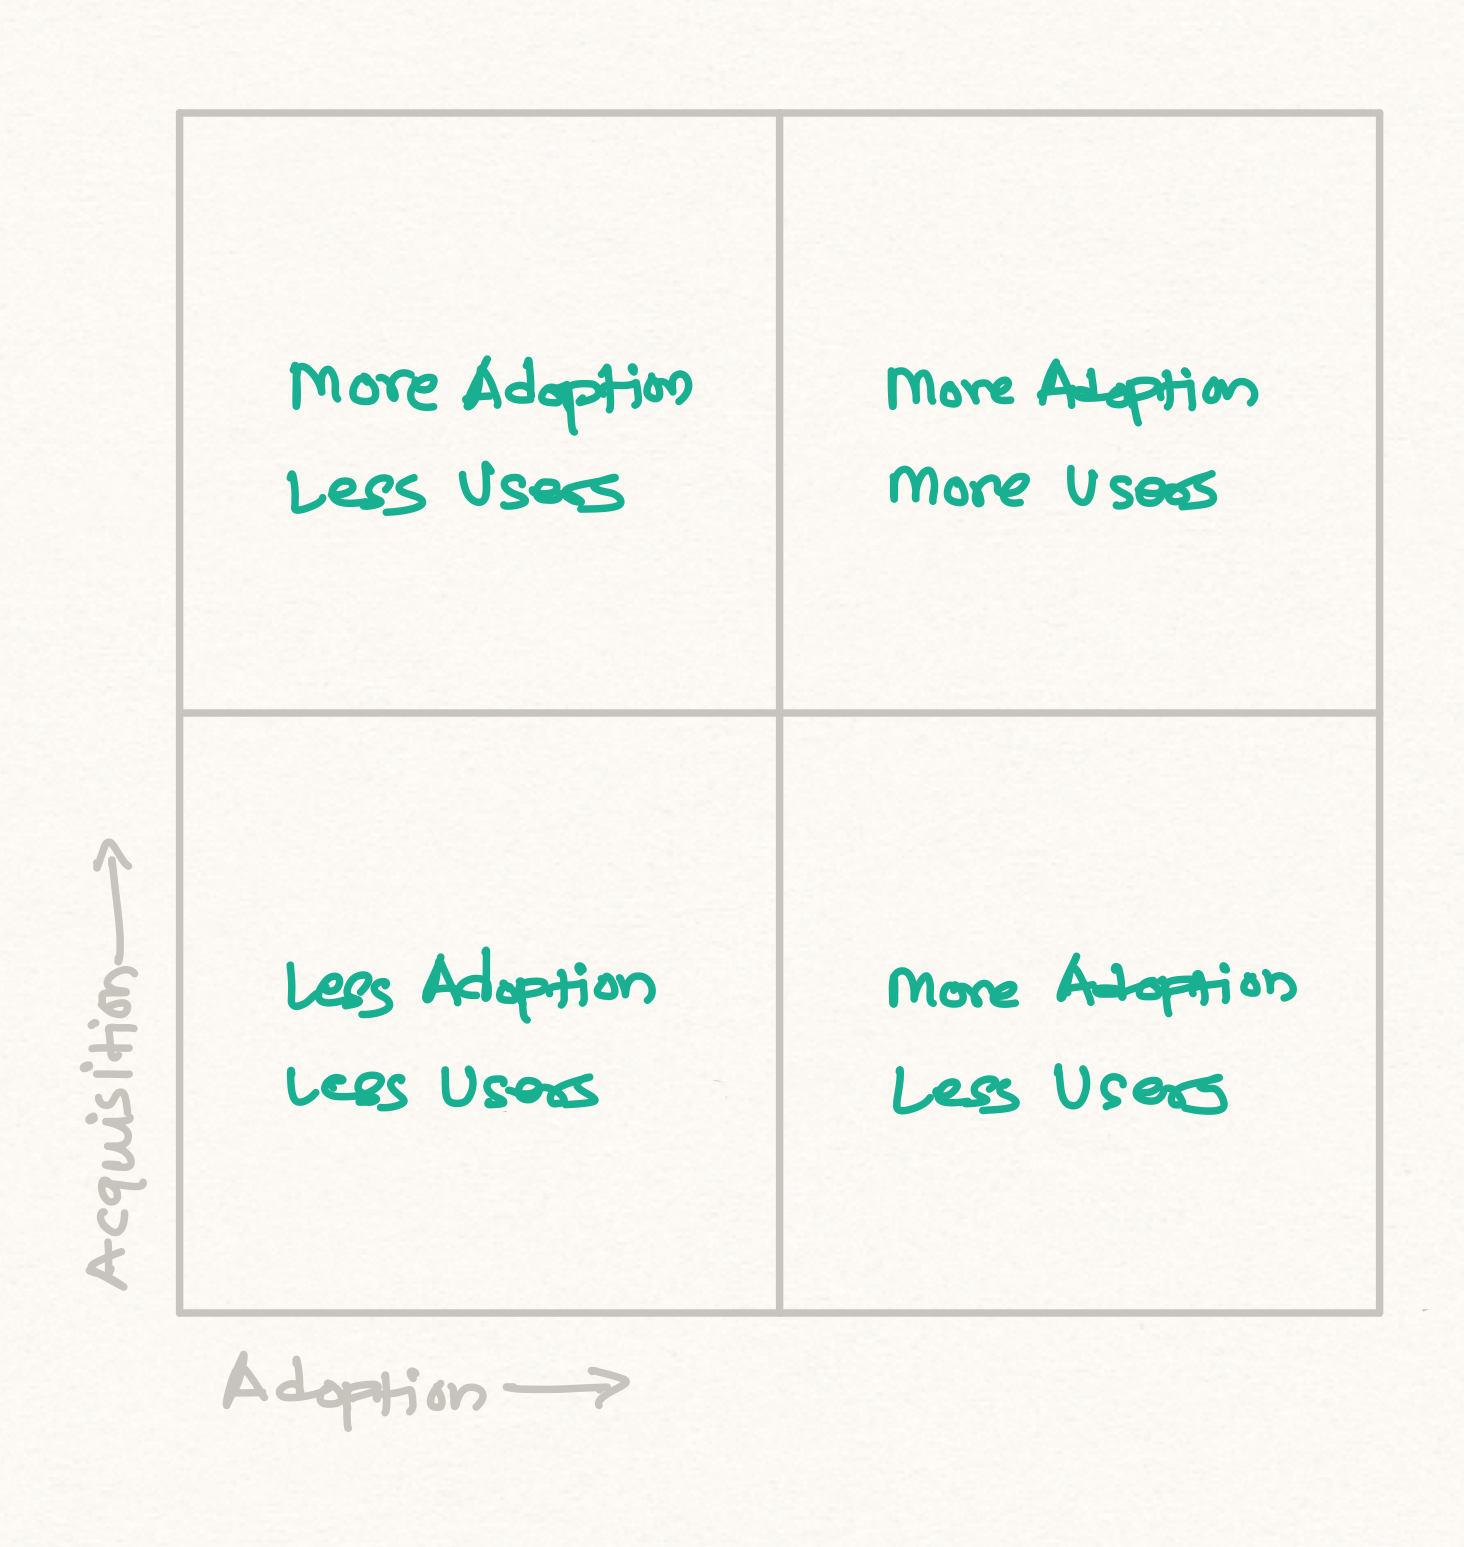
Let’s try to understand every single scenario and how it helps us in hiring:
| What it means | Hire or not? | |
| More adoption and low users | It means your product is getting adopted i.e., it is solving a real problem, but enough users are not using it. This is also how ‘product-market fit’ looks like. So it is time to invest in increasing the demand. It could mean plenty of things: increase the lead pipeline, reduce the price, reduce the deal closure time, make the signup/upgrade flow self-serve, etc. | Maybe in the demand team, but optimization of growth processes should be the priority. |
| Low adoption and more users | It means more users are trying your product, but very few are finding value. This is where you need to invest in improving the adoption, improving the performance, increasing release cycles, etc. | Maybe in the supply team especially hiring Product Managers, but the major focus should be on optimizing engineering processes. |
| Low adoption and low users | Plain and simple. You need to invest in both supply and demand sides of things. But, again, you don’t have to start hiring. Instead, fix things that are broken. Look at things from the first principle perspective. | Absolutely not! There is a good possibility that there is no demand for your product or it has not met product-market fit. |
| More adoption and more users | This is where you have to start hiring blindly because you have cracked both the adoption and acquisition parts of the equation. Now all you care about is growth which could be achieved by hiring more people. | You have cracked both the demand and supply sides. So it is a good time to hire more unless you think like Basecamp. |
The obvious question is determining a good benchmark for adoption and acquisition. Product or feature adoption varies from product to feature, but I strongly recommend you read Intercom on Product Management; they have done a great job explaining feature adoption. As far as growth metrics are concerned, they also vary from company to company and phase to phase. For example, if you are in the super early stage, then 100% growth MoM would be feasible for you, but 30-40% growth MoM would be treated as a victory as the product matures.
How does this help me as a PM?
Unfortunately, the Product Manager is the most influential person in a product organization but has little control over the organization. Unless you are a senior product leader, you are very unlikely to have a say in the hiring decisions. However, you could always provide opinions in the hiring decisions. After all, delivering a successful product is what you care about. If your peers are hiring at the wrong phase, you will be able to figure it out.
And that’s all we have in the fourth part of the series. I hope understanding the output curve was helpful to you. Feel free to share your feedback at nihar@sawant.me. I am more than happy to hear your thoughts.
You might also like
Get the latest posts delivered right to your inbox.
Prefer RSS? Use this URL in your favorite RSS reader: https://nihar.sawant.me/rss